Subject: Marine Geospatial Ecology Tools (MGET) help
Text archives
| From: | "Jason Roberts" <> |
|---|---|
| To: | "'Matt Love'" <> |
| Cc: | <> |
| Subject: | RE: [mget-help] Vector line from component raster symbolization |
| Date: | Fri, 3 Feb 2012 16:59:50 -0500 |
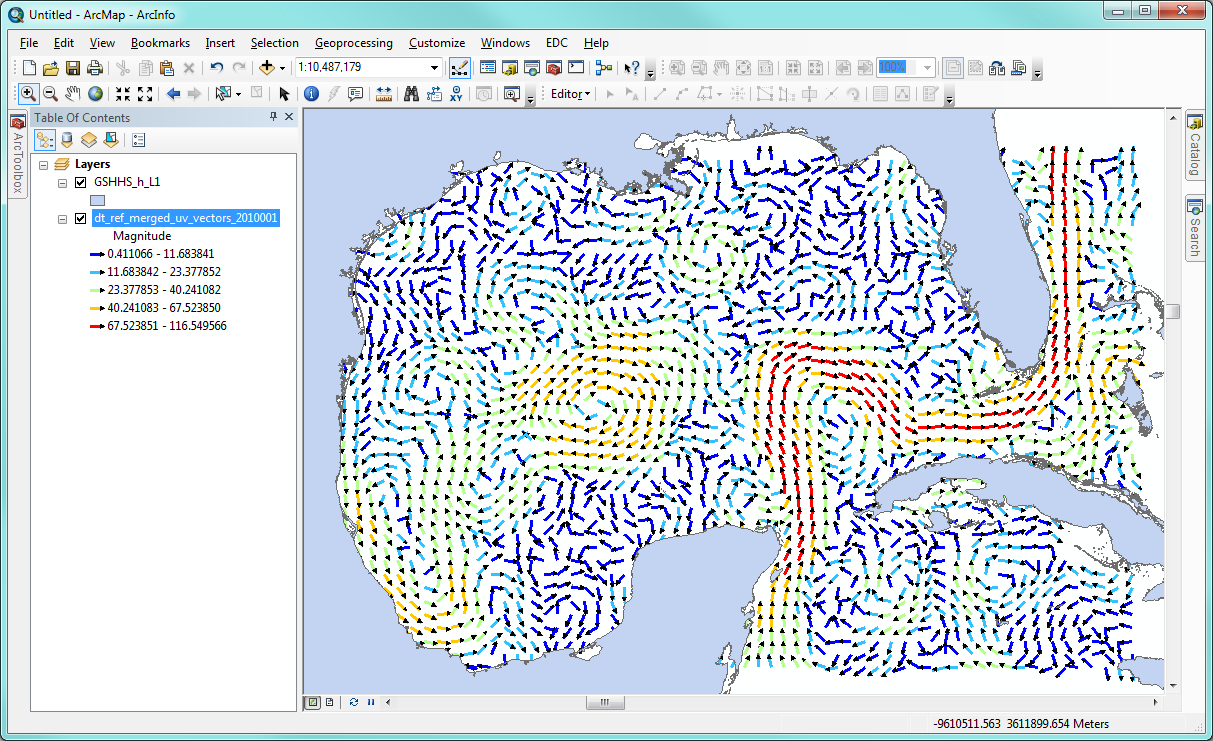
Matt, You can view more details of what MGET is doing by turning on verbose logging. See here. This can dump out quite a lot of stuff, depending on which MGET tool is run. You can tweak the .ini file manually to reduce some of it. In this case, the tool is not accessing Matlab. It is invoking a C++ program I wrote called vectorshp.exe. You can find it in your MGET installation tree (on Arc 10, it will be C:\Python26\ArcGIS10.0\Lib\site-packages\GeoEco\Bin\win32\vectorshp.exe). That program does the work of reading u and v rasters and creating a shapefile of lines. I used a C++ program because it is extremely fast compared to other approaches (e.g. using the ArcGIS geoprocessor cursors). I went ahead and modified the vectorshp program to have a new option that causes it to generate lines having all the same length. You can try it out like this: 1. Shut down all ArcGIS programs. 2. Back up the file C:\Python26\ArcGIS10.0\Lib\site-packages\GeoEco\SpatialAnalysis\Lines.py to a safe location. 3. Overwrite that file with the one attached to this message. This one instructs vectorshp.exe to generate uniform-length lines. 4. Download the new version of vectorshp.exe from here and save it to C:\Python26\ArcGIS10.0\Lib\site-packages\GeoEco\Bin\win32, overwriting the vectorshp.exe that is already there. 5. Start ArcGIS and try the Create Lines From Vector Component Rasters tool again. Use a scale factor of 1. 6. Add the resulting lines to a map. Set the symbology to Quantiles, Graduated Colors. Use the Magnitude attribute. Pick a color ramp. If you want arrows on the end to show which way the current is going, you can change the lines to “Arrow at End”. I was not able to figure out how to make the arrowhead color the same as the line color though. If you figure that out, let me know. If you want to restore the previous functionality (have lines proportional to magnitude) then replace Lines.py with your backup copy. Let me know how well this works for you. Here’s a crude example from the Aviso DT-MADT 1/3 degree geostrophic currents for 1/1/2010.
Jason From: Matt Love [mailto:] Thank you for the explanation Jason. Is there any way to access the code to view the processes going on in the back ground. It sounds like you may be accessing Matlab functions through python. I saw you had a python development page that is currently under construction. Here is the work around I employed for making arrows the same length in ArcMap,
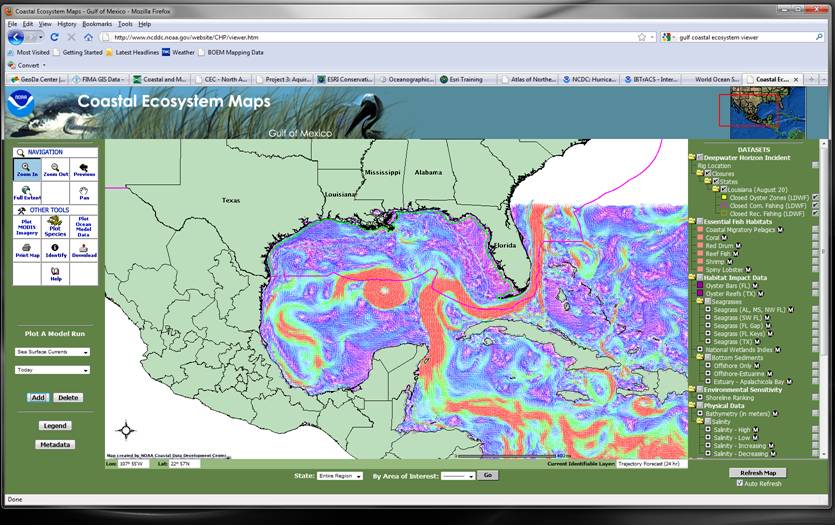
That worked but was not very elegant. I was trying to replicate the illustration used by NCDDC for their NCOM models (1/8 degree resolution) which look great at the scale of the entire Gulf of Mexico.
Here is an example from today:
From: Jason Roberts [] Hi Matt, When we developed this tool, the goal was to produce a “quiver plot”, which is a field of arrows pointing in the direction of flow, with lengths scaled to the magnitude of flow. It would be nice if ArcGIS supported that directly as a symbology option; for example, given point features, it could draw arrows with the direction and magnitude determined by two attributes of the points. But it does not have that capability, so we had to resort to a hack: the MGET tool creates a line feature class with the lines drawn in the direction of flow and with lengths proportional to the magnitude of the flow. The Scale Factor parameter of the tool is basically a multiplier to make the lines shorter or longer, to manage their appearance. Instead, you would like the lines to all be the same length, regardless of the magnitude of the flow. You would then use the magnitude attribute to color them according to magnitude. That sounds like an interesting approach. Unfortunately the tool cannot currently do that because it always draws the lines proportionally to the magnitude. I cannot think of an easy way to achieve the desired effect. It is possible to use map algebra to produce u and v rasters in which each cell has the same magnitude of flow, just a different direction. If you ran the MGET tool on those, you would get lines pointed in the direction of flow but that were all the same length. Unfortunately the magnitude attribute of those lines would be the same value, so you could not color the lines according to magnitude. Perhaps if you then computed magnitude in raster form using map algebra, then converted that raster to points, then did a spatial join of the points to the uniform-length lines… That is very complicated but seems possible. Is producing maps of this kind an important capability? I might be able to modify the MGET tool to allow this as an option. It would have a checkbox or something that told it to generate lines of uniform length but still write the attributes indicating the true magnitude. Best, Jason From: Matt Love [] I am trying to figure out how to modify the symbolization of the vector lines developed from ocean current component rasters. I would like to modify the vector line symbology from line length representing magnitude, to defined or classified colors representing magnitude. In my attempt to do this I realized I do not understand how the lines are generated from the component rasters in the first place. I could not find clues in the tool code. What am I missing? Thanks Matt
|

#
# Copyright (C) 2009 Jason J. Roberts
#
# This program is free software; you can redistribute it and/or
# modify it under the terms of the GNU General Public License
# as published by the Free Software Foundation; either version 2
# of the License, or (at your option) any later version.
#
# This program is distributed in the hope that it will be useful,
# but WITHOUT ANY WARRANTY; without even the implied warranty of
# MERCHANTABILITY or FITNESS FOR A PARTICULAR PURPOSE. See the
# GNU General Public License (available in the file LICENSE.TXT)
# for more details.
#
# You should have received a copy of the GNU General Public License
# along with this program; if not, write to the Free Software
# Foundation, Inc., 51 Franklin Street, Fifth Floor, Boston, MA 02110-1301,
USA.
import os
from GeoEco.ArcGIS import GeoprocessorManager, ArcGISDependency
from GeoEco.Datasets import Table
from GeoEco.Datasets.ArcGIS import ArcGISCopyableTable
from GeoEco.DynamicDocString import DynamicDocString
from GeoEco.Internationalization import _
from GeoEco.Logging import Logger, ProgressReporter
class Lines(object):
__doc__ = DynamicDocString()
@classmethod
def ShapefileFromVectorComponentGrids(cls, xGrid, yGrid, shapefile,
scaleFactor, overwriteExisting=False):
cls.__doc__.Obj.ValidateMethodInvocation()
# Perform additional validation.
if xGrid.Dimensions != u'yx':
raise ValueError(_(u'The X components grid has more than two
dimensions. Please provide a grid that has two dimensions.'))
if yGrid.Dimensions != u'yx':
raise ValueError(_(u'The Y components grid has more than two
dimensions. Please provide a grid that has two dimensions.'))
xSR = xGrid.GetSpatialReference('obj')
ySR = yGrid.GetSpatialReference('obj')
if (xSR is not None and ySR is None) or (xSR is None and ySR is not
None) or (xSR is not None and ySR is not None and not xSR.IsSame(ySR)):
raise ValueError(_(u'The X components grid has a different
coordinate system than the Y components grid. Please provide grids with the
coordinate systems.'))
if xGrid.Shape != yGrid.Shape:
raise ValueError(_(u'The X components grid has a different width
or height (in cells) than the Y components grid. Please provide grids that
have the same width and height as each other.'))
if xGrid.CoordIncrements[0] is None or xGrid.CoordIncrements[1] is
None:
raise ValueError(_(u'The X components grid does not have a
constant cell size (some cells are wider or taller than others). Please
provide a grid that has a constant cell size.'))
if yGrid.CoordIncrements[0] is None or yGrid.CoordIncrements[1] is
None:
raise ValueError(_(u'The Y components grid does not have a
constant cell size (some cells are wider or taller than others). Please
provide a grid that has a constant cell size.'))
if xGrid.CoordIncrements[0] / yGrid.CoordIncrements[0] > 1.000001 or
xGrid.CoordIncrements[0] / yGrid.CoordIncrements[0] < 0.999999 or
xGrid.CoordIncrements[1] / yGrid.CoordIncrements[1] > 1.000001 or
xGrid.CoordIncrements[1] / yGrid.CoordIncrements[1] < 0.999999:
raise ValueError(_(u'The X components grid has a different cell
size than the Y components grid. Please provide grids that have the same cell
size.'))
## if abs(xGrid.CenterCoords['x', 0] - yGrid.CenterCoords['x', 0]) /
xGrid.CoordIncrements[0] > 0.001 or abs(xGrid.CenterCoords['y', 0] -
yGrid.CenterCoords['y', 0]) / xGrid.CoordIncrements[1] > 0.001:
## raise ValueError(_(u'The X components grid has a different
extent than the Y components grid. Please provide grids that have the same
extent.'))
if xGrid.NoDataValue != yGrid.NoDataValue:
raise ValueError(_(u'The X components grid has a different No
Data value than the Y components grid. Please provide grids that have the
same No Data value.'))
# Create 32-bit floating point numpy arrays.
import numpy
xNumpyArray = numpy.flipud(xGrid.Data[:])
if xGrid.DataType == u'float32':
noDataValue = float(xGrid.NoDataValue)
else:
noDataValue = float(numpy.cast['float32'](xGrid.NoDataValue))
xNumpyArray = numpy.cast['float32'](xNumpyArray)
if numpy.isinf(noDataValue):
noDataValue = -3.4028234663852886e+038
xNumpyArray[numpy.isinf(xNumpyArray)] = noDataValue
yNumpyArray = numpy.flipud(yGrid.Data[:])
if yGrid.DataType != u'float32':
yNumpyArray = numpy.cast['float32'](yNumpyArray)
if noDataValue == -3.4028234663852886e+038:
yNumpyArray[numpy.isinf(yNumpyArray)] = noDataValue
# Create 32-bit floating point rasters in a temporary
# directory so we can pass them to vectorshp.exe.
from GeoEco.DataManagement.Directories import TemporaryDirectory
tempDir = TemporaryDirectory()
xBinaryFile = os.path.join(tempDir.Path, 'x.bin')
xNumpyArray.tofile(xBinaryFile)
yBinaryFile = os.path.join(tempDir.Path, 'y.bin')
yNumpyArray.tofile(yBinaryFile)
# Execute vectorshp.exe to create the shapefile.
from GeoEco.DataManagement.Processes import ChildProcess
args = [xBinaryFile,
yBinaryFile,
shapefile,
'float',
repr(xGrid.Shape[1]), # Width in cells
repr(xGrid.Shape[0]), # Height in cells
repr(xGrid.CoordIncrements[0]), # Cell size
repr(xGrid.MinCoords['x', 0]), # Lower-left corner X
repr(xGrid.MinCoords['y', 0]), # Lower-left corner Y
'-n', repr(noDataValue),
'-s', repr(scaleFactor),
'-u']
oldLogInfoAsDebug = Logger.GetLogInfoAsDebug()
Logger.SetLogInfoAsDebug(True)
try:
ChildProcess.ExecuteProgramInBinDirectory(u'vectorshp', args,
windowState=u'invisible')
finally:
Logger.SetLogInfoAsDebug(oldLogInfoAsDebug)
# If a coordinate system as been defined for the rasters,
# create a .prj file for the shapefile.
if xSR is not None:
prjFile = os.path.splitext(shapefile)[0] + '.prj'
Logger.Debug(_(u'Writing coordinate system WKT to %(file)s.') %
{u'file': prjFile})
try:
f = open(prjFile, 'w')
try:
f.write(str(xGrid.GetSpatialReference('ArcGIS')))
finally:
f.close()
except Exception, e:
raise IOError(_(u'Failed to write file %(file)s: %(e)s:
%(msg)s.') % {u'file': prjFile, u'e': e.__class__.__name__, u'msg': str(e)})
class ArcGISLines(object):
__doc__ = DynamicDocString()
@classmethod
def FromVectorComponentRasters(cls, xRaster, yRaster, lines, scaleFactor,
overwriteExisting=False):
cls.__doc__.Obj.ValidateMethodInvocation()
try:
Logger.Info(_(u'Creating lines in %(fc)s from vector component
rasters %(r1)s and %(r2)s.') % {u'fc': lines, u'r1': xRaster, u'r2': yRaster})
# If the output feature class is a shapefile, create it
# directly.
from GeoEco.Datasets.ArcGIS import ArcGISRasterBand
xGrid = ArcGISRasterBand.ConstructFromArcGISPath(xRaster)
yGrid = ArcGISRasterBand.ConstructFromArcGISPath(yRaster)
if os.path.splitext(lines)[1].lower() == '.shp':
Lines.ShapefileFromVectorComponentGrids(xGrid, yGrid, lines,
scaleFactor, overwriteExisting=overwriteExisting)
# Otherwise, create a shapefile in a temporary directory and
# then copy it to the output feature class.
else:
from GeoEco.DataManagement.Directories import
TemporaryDirectory
tempDir = TemporaryDirectory()
shapefile = os.path.join(tempDir.Path, 'vectors.shp')
Lines.ShapefileFromVectorComponentGrids(xGrid, yGrid,
shapefile, scaleFactor)
gp = GeoprocessorManager.GetWrappedGeoprocessor()
gp.RefreshCatalog(tempDir.Path)
Logger.Debug(_(u'Copying %(src)s to %(dest)s.') % {u'src':
shapefile, u'dest': lines})
gp.FeatureClassToFeatureClass_conversion(shapefile,
os.path.dirname(lines), os.path.basename(lines))
except:
Logger.LogExceptionAsError()
raise
@classmethod
def ConnectSequentialPoints(cls, points, lines, where=None,
orderByFields=None, orderByDirections=None, idFields=None, useZ=True,
overwriteExisting=False):
cls.__doc__.Obj.ValidateMethodInvocation()
try:
raise NotImplementedError(_(u'This tool has not been implemented
yet.'))
Logger.Info(_(u'Reading sequential points from %(points)s and
inserting lines into %(lines)s.') % {u'lines': lines, u'points': points})
except:
Logger.LogExceptionAsError()
raise
class ShapefileFromVectorComponentGrids(Table, ArcGISCopyableTable):
__doc__ = DynamicDocString()
def __init__(self, xGrid, yGrid, scaleFactor, parentCollection=None,
queryableAttributes=None, queryableAttributeValues=None):
# Initialize our properties.
self._XGrid = xGrid
self._YGrid = yGrid
self._ScaleFactor = scaleFactor
self._TempDir = None
self._DisplayName = _(u'vectors for x components = %(dnx)s, y
components = %(dny)s') % {u'dnx': xGrid, u'dny': yGrid}
# Initialize the base class.
super(ShapefileFromVectorComponentGrids,
self).__init__(parentCollection=parentCollection, queryableAttributes=None,
queryableAttributeValues=queryableAttributeValues)
def _GetDisplayName(self):
return self._DisplayName
def _GetLazyPropertyPhysicalValue(self, name):
return None
def _Close(self):
self._TempDir = None
super(ShapefileFromVectorComponentGrids, self)._Close()
@classmethod
def _TestCapability(cls, capability):
if isinstance(cls, ShapefileFromVectorComponentGrids):
return RuntimeError(_(u'The %(cls)s class does not support the
"%(cap)s" capability.') % {u'cls': cls.__class__.__name__, u'cap':
capability})
return RuntimeError(_(u'The %(cls)s class does not support the
"%(cap)s" capability.') % {u'cls': cls.__name__, u'cap': capability})
def GetArcGISCopyablePath(self):
# If we have not created the shapefile in a temporary
# directory, do it now. If we catch an exception, call
# _Close() to delete the temporary directory.
if self._TempDir is None:
try:
self._TempDir = self._CreateTempDirectory()
Lines.ShapefileFromVectorComponentGrids(self._XGrid,
self._YGrid, os.path.join(self._TempDir, 'Vectors.shp'), self._ScaleFactor)
except:
self._Close()
raise
# Return the path to the shapefile in the temporary directory.
return os.path.join(self._TempDir, 'Vectors.shp')
###############################################################################
# Metadata: module
###############################################################################
from GeoEco.Datasets import Grid
from GeoEco.Dependencies import PythonAggregatedModuleDependency
from GeoEco.Metadata import *
from GeoEco.Types import *
AddModuleMetadata(shortDescription=_(u'Provides methods for general-purpose
operations with lines.'))
###############################################################################
# Metadata: Lines class
###############################################################################
AddClassMetadata(Lines,
shortDescription=_(u'Provides methods for general-purpose operations with
lines, using only free open-source software such as GDAL and OGR.'))
## isExposedAsCOMServer=True,
## comIID=u'{8EC65E73-2E70-4CA8-A69E-D2BDC81984A9}',
## comCLSID=u'{014E1B6E-059D-4190-B27B-66A021D6A008}')
# Public method: Lines.ShapefileFromVectorComponentGrids
AddMethodMetadata(Lines.ShapefileFromVectorComponentGrids,
shortDescription=_(u'Creates a shapefile of lines representing vectors,
similar to a "quiver plot".'),
isExposedToPythonCallers=True,
dependencies=[PythonAggregatedModuleDependency('numpy')])
AddArgumentMetadata(Lines.ShapefileFromVectorComponentGrids, u'cls',
typeMetadata=ClassOrClassInstanceTypeMetadata(cls=Lines),
description=_(u'%s class or an instance of it.') % Lines.__name__)
AddArgumentMetadata(Lines.ShapefileFromVectorComponentGrids, u'xGrid',
typeMetadata=ClassInstanceTypeMetadata(Grid),
description=_(
u"""2D grid representing the X components of the vector field, where
positive values indicate rightward flow and negative values indicate
leftward flow.
If you are running this tool on ocean currents rasters, provide the u
raster for this parameter."""))
AddArgumentMetadata(Lines.ShapefileFromVectorComponentGrids, u'yGrid',
typeMetadata=ClassInstanceTypeMetadata(Grid),
description=_(
u"""2D grid representing the Y components of the vector field, where
positive values indicate upward flow and negative values indicate
downward flow.
This grid must have the same coordinate system, extent, dimensions,
and cell size as the X components grid.
If you are running this tool on ocean currents rasters, provide the v
raster for this parameter."""))
AddArgumentMetadata(Lines.ShapefileFromVectorComponentGrids, u'shapefile',
typeMetadata=ShapefileTypeMetadata(deleteIfParameterIsTrue=u'overwriteExisting',
createParentDirectories=True),
description=_(
u"""Line shapefile to create.
The shapefile will contain one line for each grid cell that contains
data (both X and Y component values). The line will originate at the
cell center and have the length and direction described by the
component values. The length will be adjusted by the Scale Factor
parameter.
Each line will have two attributes:
* Magnitude - the unscaled magnitude of the vector, computed from the
component values using the Pythagorean theorem.
* Direction - the direction of the vector, in degrees, where 0 is
right, 90 is up, -90 is down, and 180 is left.
"""))
AddArgumentMetadata(Lines.ShapefileFromVectorComponentGrids, u'scaleFactor',
typeMetadata=FloatTypeMetadata(mustBeGreaterThan=0.0),
description=_(
u"""Factor for scaling lines lengths.
Use this parameter to scale the lines output by this tool to lengths
that are visually appealing. If the lines are too short, they will
resemble a grid of dots and you will not be able to discern the flow
of the vector field. If the lines are too long, they will overlap each
other and resemble a plate of spaghetti.
If the vectors all have about the same magnitude, then a good approach
is to scale the lines so that the longest one is about as long as the
raster cell size. But if there are a few very long vectors, then you
may prefer to scale the lines so that the average-length vector is as
long as the raster cell size.
To estimate an appropriate scale factor, divide the cell size by your
estimate of the maximum (or mean) unscaled line length. For example,
if the cell size is 25,000 meters, and the input grids represent ocean
current velocity in centimeters per second, and you believe the
maximum (or mean) velocity is about 200 cm/s:
scale factor = 25000 / 200 = 125
If the rasters represented velocity in meters per second:
scale factor = 25000 / 2 = 12500
Use a scale factor of 1 to indicate that the lines should not be
scaled."""))
AddArgumentMetadata(Lines.ShapefileFromVectorComponentGrids,
u'overwriteExisting',
typeMetadata=BooleanTypeMetadata(),
description=_(
u"""If True, the output shapefile will be overwritten, if it exists.
If False, a ValueError will be raised if the output shapefile
exists."""))
###############################################################################
# Metadata: ArcGISLines class
###############################################################################
AddClassMetadata(ArcGISLines,
shortDescription=_(u'Provides methods for general-purpose operations with
ArcGIS lines.'),
isExposedAsCOMServer=True,
comIID=u'{8EC65E73-2E70-4CA8-A69E-D2BDC81984A9}',
comCLSID=u'{014E1B6E-059D-4190-B27B-66A021D6A008}')
# Public method: ArcGISLines.FromVectorComponentRasters
AddMethodMetadata(ArcGISLines.FromVectorComponentRasters,
shortDescription=_(u'Given rasters representing the x and y components of
a vector field, such as the u and v rasters for ocean currents, this tool
creates a feature class of lines representing the vectors, similar to a
"quiver plot".'),
isExposedToPythonCallers=True,
isExposedByCOM=True,
isExposedAsArcGISTool=True,
arcGISDisplayName=_(u'Create Lines From Vector Component Rasters'),
arcGISToolCategory=_(u'Spatial Analysis\\Create Lines'),
dependencies=[ArcGISDependency(9, 1)])
AddArgumentMetadata(ArcGISLines.FromVectorComponentRasters, u'cls',
typeMetadata=ClassOrClassInstanceTypeMetadata(cls=ArcGISLines),
description=_(u'%s class or an instance of it.') % ArcGISLines.__name__)
AddArgumentMetadata(ArcGISLines.FromVectorComponentRasters, u'xRaster',
typeMetadata=ArcGISRasterLayerTypeMetadata(mustExist=True),
description=_(
u"""Raster representing the X components of the vector field, where
positive values indicate rightward flow and negative values indicate
leftward flow.
If you are running this tool on ocean currents rasters, provide the u
raster for this parameter."""),
arcGISDisplayName=_(u'X components raster'))
AddArgumentMetadata(ArcGISLines.FromVectorComponentRasters, u'yRaster',
typeMetadata=ArcGISRasterLayerTypeMetadata(mustExist=True),
description=_(
u"""Raster representing the Y components of the vector field, where
positive values indicate upward flow and negative values indicate
downward flow.
This raster must have the same coordinate system, extent, dimensions,
and cell size as the X components raster.
If you are running this tool on ocean currents rasters, provide the v
raster for this parameter."""),
arcGISDisplayName=_(u'Y components raster'))
AddArgumentMetadata(ArcGISLines.FromVectorComponentRasters, u'lines',
typeMetadata=ArcGISFeatureClassTypeMetadata(mustBeDifferentThanArguments=[u'xRaster',
u'yRaster'], deleteIfParameterIsTrue=u'overwriteExisting',
createParentDirectories=True),
description=_(
u"""Line feature class to create.
The feature class will contain one line for each raster cell that
contains data (both X and Y component values). The line will originate
at the cell center and have the length and direction described by the
component values. The length will be adjusted by the Scale Factor
parameter.
Each line will have two attributes:
* Magnitude - the unscaled magnitude of the vector, computed from the
component values using the Pythagorean theorem.
* Direction - the direction of the vector, in degrees, where 0 is
right, 90 is up, -90 is down, and 180 is left.
"""),
direction=u'Output',
arcGISDisplayName=_(u'Output line feature class'))
AddArgumentMetadata(ArcGISLines.FromVectorComponentRasters, u'scaleFactor',
typeMetadata=FloatTypeMetadata(mustBeGreaterThan=0.0),
description=Lines.ShapefileFromVectorComponentGrids.__doc__.Obj.Arguments[4].Description,
arcGISDisplayName=_(u'Scale factor'))
AddArgumentMetadata(ArcGISLines.FromVectorComponentRasters,
u'overwriteExisting',
typeMetadata=BooleanTypeMetadata(),
description=_(
u"""If True, the output feature class will be overwritten, if it
exists. If False, a ValueError will be raised if the output feature
class exists."""),
initializeToArcGISGeoprocessorVariable=u'OverwriteOutput')
# Public method: ArcGISLines.ConnectSequentialPoints
AddMethodMetadata(ArcGISLines.ConnectSequentialPoints,
shortDescription=_(u'Given a sequence of points, such as the locations of
a migrating animal, this tool creates lines that connect the points in
sequence. Except in special cases, ArcGIS 9.2 or later is required for this
tool.'),
isExposedToPythonCallers=True,
isExposedByCOM=True,
## isExposedAsArcGISTool=True,
arcGISDisplayName=_(u'Connect Sequential Points'),
arcGISToolCategory=_(u'Spatial Analysis\\Create Lines'),
dependencies=[ArcGISDependency(9, 1)])
CopyArgumentMetadata(ArcGISLines.FromVectorComponentRasters, u'cls',
ArcGISLines.ConnectSequentialPoints, u'cls')
AddArgumentMetadata(ArcGISLines.ConnectSequentialPoints, u'points',
typeMetadata=ArcGISFeatureLayerTypeMetadata(allowedShapeTypes=[u'Point'],
mustExist=True),
description=_(u"""Input points features."""),
arcGISDisplayName=_(u'Input point features'))
AddArgumentMetadata(ArcGISLines.ConnectSequentialPoints, u'lines',
typeMetadata=ArcGISFeatureClassTypeMetadata(mustBeDifferentThanArguments=[u'points'],
deleteIfParameterIsTrue=u'overwriteExisting', createParentDirectories=True),
description=_(u"""Line feature class to create."""),
direction=u'Output',
arcGISDisplayName=_(u'Output line feature class'))
AddArgumentMetadata(ArcGISLines.ConnectSequentialPoints, u'where',
typeMetadata=SQLWhereClauseTypeMetadata(canBeNone=True),
description=_(
u"""SQL WHERE clause expression that specifies the subset of points to
process. If this parameter is not provided, all of the points will be
processed. If this parameter is provided but the underlying database
does not support WHERE clauses, an error will be raised.
The exact syntax of this expression depends on the underlying database
and the type of connection used to access it. ESRI recommends you
reference fields using the following syntax:
* If you're querying ArcInfo coverages, shapefiles, INFO tables or
dBASE tables (.dbf files), enclose field names in double quotes in
the SQL expression: "MY_FIELD".
* If you're querying Microsoft Access tables or personal
geodatabase tables, enclose field names in square brackets:
[MY_FIELD].
* If you're querying ArcSDE geodatabase tables, an ArcIMS feature
class, or an ArcIMS image service sublayer, don't enclose field
names: MY_FIELD.
"""),
arcGISDisplayName=_(u'Where clause specifying the points to process'),
arcGISParameterDependencies=[u'points'],)
AddArgumentMetadata(ArcGISLines.ConnectSequentialPoints, u'orderByFields',
typeMetadata=ListTypeMetadata(elementType=ArcGISFieldTypeMetadata(mustExist=True),
minLength=1, canBeNone=True),
description=_(
u"""Fields to order the points sequentially prior to connecting them
with lines. If no fields are provided, the points will be ordered in
the default sequence determined by the underlying database. For
shapefiles or geodatabases, this is usually by the FID or OBJECTID
fields, respectively.
For each field you specify here, two fields will be added to the
output lines: one indicating the value of field at the start point for
the line, and one indicating the value at the end point. The line
fields will have the same name as the point fields with a '1' or '2'
appended for the start and end values, respectively.
ArcGIS 9.2 or later is required for this parameter. If you have an
earlier version, you can only connect the points using the default
sequence determined by the underlying database, because earlier
versions do not allow this tool to specify a different ordering
scheme."""),
arcGISDisplayName=_(u'Fields for ordering the points sequentially'),
arcGISParameterDependencies=[u'points'],
dependencies=[ArcGISDependency(9, 2)])
AddArgumentMetadata(ArcGISLines.ConnectSequentialPoints, u'orderByDirections',
typeMetadata=ListTypeMetadata(elementType=UnicodeStringTypeMetadata(allowedValues=[u'Ascending',
u'Descending']), canBeNone=True),
description=_(
u"""List of strings, either 'Ascending' or 'Descending', that specify
the sort directions for the fields used to order the points
sequentially. You may omit this parameter entirely, or only specify it
for a few fields. If you do not provide a sort direction for a given
field, 'Ascending' will be used for that field."""),
arcGISDisplayName=_(u'Sort directions for ordering fields'))
AddArgumentMetadata(ArcGISLines.ConnectSequentialPoints, u'idFields',
typeMetadata=ListTypeMetadata(elementType=ArcGISFieldTypeMetadata(mustExist=True),
minLength=1, canBeNone=True),
description=_(
u"""Fields to group points into distinct lines. If no fields are
specified, a single line will be created that connects all of the
points.
Use this parameter when your input feature layer or feature class
contains points for several different lines. For example, if your
points represent the locations of several migrating animals, provide
the field that identifies which animal the point is associated with,
and the tool will create one line for each animal.
Each field you specify here will be copied to the output lines."""),
arcGISDisplayName=_(u'Fields for identifying distinct lines'),
arcGISParameterDependencies=[u'points'])
AddArgumentMetadata(ArcGISLines.ConnectSequentialPoints, u'useZ',
typeMetadata=BooleanTypeMetadata(),
description=_(
u"""If True and the points contain Z values, the Z values will be used
when creating the lines (i.e. the Z values from the starting and
ending points will be used for on the respective endpoints of the
line). If False or the points do not contain Z values, then Z values
will not be used when creating the lines.
This parameter will be ignored if the points do not contain Z
values."""),
arcGISDisplayName=_(u'Use Z values'))
CopyArgumentMetadata(ArcGISLines.FromVectorComponentRasters,
u'overwriteExisting', ArcGISLines.ConnectSequentialPoints,
u'overwriteExisting')
###############################################################################
# Metadata: ShapefileFromVectorComponentGrids class
###############################################################################
AddClassMetadata(ShapefileFromVectorComponentGrids,
shortDescription=_(u'An ArcGIS-copyable Table representing the vectors of
x and y component rasters, similar to a "quiver plot".'))
# TODO: Add metadata.
###############################################################################
# Batch processing versions of methods
###############################################################################
from GeoEco.BatchProcessing import BatchProcessing
from GeoEco.DataManagement.Fields import Field
BatchProcessing.GenerateForMethod(ArcGISLines.FromVectorComponentRasters,
inputParamNames=[u'xRaster', u'yRaster'],
inputParamFieldArcGISDisplayNames=[_(u'X components raster field'), _(u'Y
components raster field')],
inputParamDescriptions=[
_(u"""%s paths of the rasters representing the X components of the
vector fields, where positive values indicate rightward flow and
negative values indicate leftward flow.
If you are running this tool on ocean currents rasters, provide the u
rasters for this parameter."""),
_(u"""%s paths of the rasters representing the Y components of the
vector fields, where positive values indicate upward flow and negative
values indicate downward flow.
These rasters must have the same coordinate system, extent,
dimensions, and cell size as the X components rasters.
If you are running this tool on ocean currents rasters, provide the v
rasters for this parameter.""")],
outputParamNames=[u'lines'],
outputParamFieldArcGISDisplayNames=[_(u'Output feature class field')],
outputParamDescriptions=[
_(u"""%s paths of the line feature classes to create.
Each feature class will contain one line for each raster cell that
contains data (both X and Y component values). The line will originate
at the cell center and have the length and direction described by the
component values. The length will be adjusted by the Scale Factor
parameter.
Each line will have two attributes:
* Magnitude - the unscaled magnitude of the vector, computed from the
component values using the Pythagorean theorem.
* Direction - the direction of the vector, in degrees, where 0 is
right, 90 is up, -90 is down, and 180 is left.
""")],
constantParamNames=[u'scaleFactor'],
processListMethodName=u'FromVectorComponentRastersInList',
processListMethodShortDescription=_(u'Given lists of rasters representing
the x and y components of vector fields, such as the u and v rasters for
ocean currents, this tool creates feature classes of lines representing the
vectors, similar to a "quiver plot".'),
processTableMethodName=u'FromVectorComponentRastersInTable',
processTableMethodShortDescription=_(u'Given a table of rasters
representing the x and y components of vector fields, such as the u and v
rasters for ocean currents, this tool creates feature classes of lines
representing the vectors, similar to a "quiver plot".'),
processArcGISTableMethodName=u'FromVectorComponentRastersInArcGISTable',
processArcGISTableMethodArcGISDisplayName=_(u'Create Lines From Vector
Component Rasters Listed in Table'),
skipExistingDescription=_(u'If True, processing will be skipped for
output feature classes that already exist.'),
overwriteExistingDescription=_(u'If True and skipExisting is False,
existing output feature classes will be overwritten.'))
###############################################################################
# Names exported by this module
###############################################################################
__all__ = ['Lines', 'ArcGISLines', 'ShapefileFromVectorComponentGrids']