Subject: Marine Geospatial Ecology Tools (MGET) help
Text archives
- From: Diesing Markus <>
- To: 'Jason Roberts' <>, "''" <>
- Subject: RE: [mget-help] Binary classification options
- Date: Thu, 31 Aug 2017 06:48:52 +0000
- Accept-language: en-GB, nb-NO, en-US
- Authentication-results: oit.duke.edu; spf=none
|
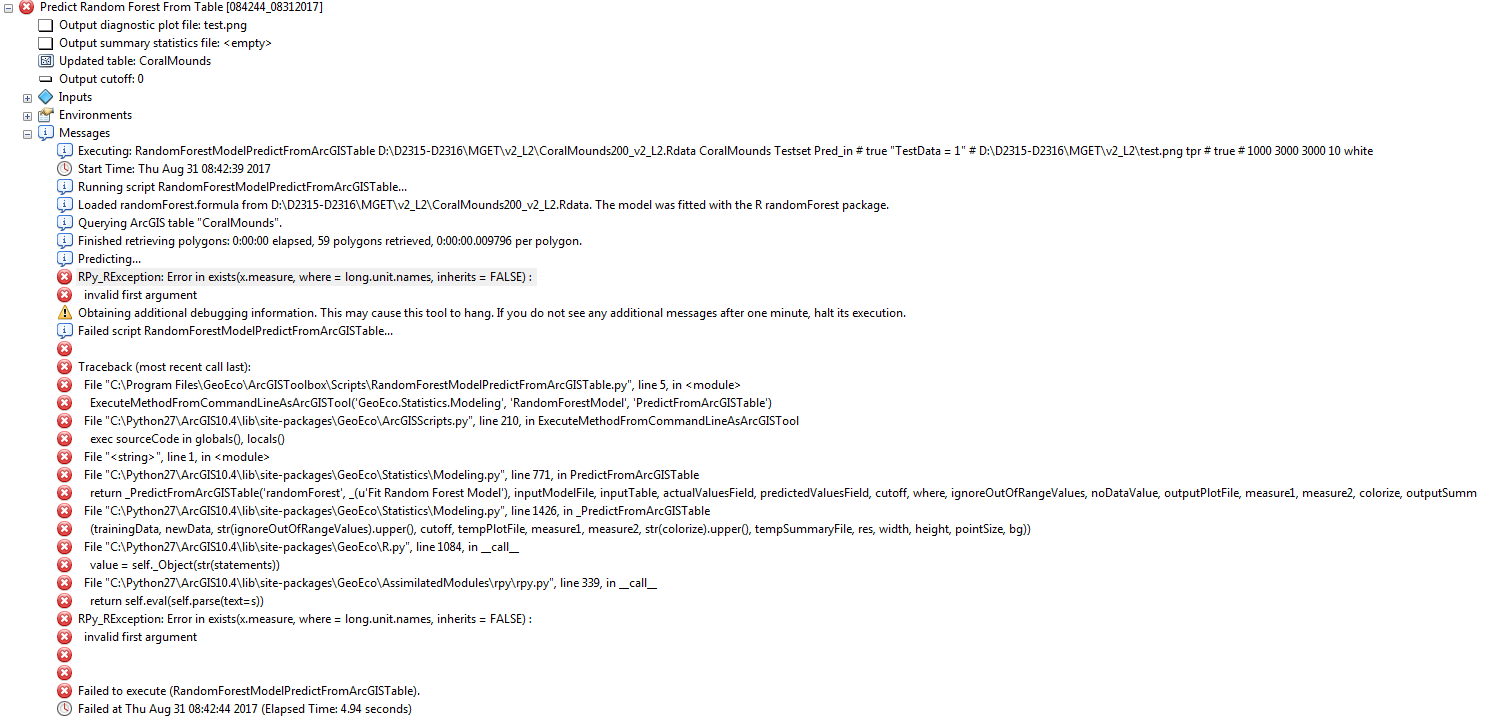
Hi Jason, Thanks for the quick reply. I have already tried to delete ‘fpr’ in the second field; however then the tool fails to execute the script. See below for the geoprocessing results. Best, Markus
From: Jason Roberts [mailto:]
Hi Markus,
Thanks for your interest in MGET. I can help you with this but am on holiday so my ability to do so is limited until next week. I looked at the code and can see that the low-level part that produces the plot was designed to allow just one performance measure but the part that produces the ArcGIS input form might not. I have to do some experiments to know for sure and am not able to at the moment.
What happens when you delete the ‘fpr’ that appears by default for the second performance measure and then run the tool (with that field blank)? Looking at the code, this might do what you want, or it might just default to using fpr instead. If it’s the latter, we need to tweak the code to interpret blank as “none”.
Best, Jason From:
[mailto:]
On Behalf Of Diesing Markus
Hi, First of all thank you for the brilliant MGET tool, which makes life for someone like me who struggles with R so much easier. I have, however, a question concerning binary classification options when using Random Forest: In the Tool Help, it is stated that I can either plot two selected performance measures against each other or just one (on the Y axis) against the model cutoff on the X axis. I am currently attempting the latter and I am struggling to understand how I specify that I do not want to select a second performance measure. As a default, there are always two measures (tpr, fpr) selected and while I am able to select other measures it’s not possible to select ‘cutoff’ or leave the second performance measure blank. So, what would I have to do to plot for example sensitivity against cutoff? Thanks a lot for your help. Regards, Markus _______________________________ Dr. Markus Diesing Norges geologiske undersøkelse (NGU) Geological Survey of Norway web: www.ngu.no
|
- [mget-help] Binary classification options, Diesing Markus, 08/29/2017
- RE: [mget-help] Binary classification options, Jason Roberts, 08/30/2017
- RE: [mget-help] Binary classification options, Diesing Markus, 08/31/2017
- RE: [mget-help] Binary classification options, Jason Roberts, 08/30/2017
Archive powered by MHonArc 2.6.19.