Subject: Marine Geospatial Ecology Tools (MGET) help
Text archives
- From: Jason Roberts <>
- To: Jan-Christopher Fischer <>
- Cc: "" <>
- Subject: RE: [mget-help] Cayula-Cornillon Fronts in ArcGIS Raster
- Date: Tue, 6 Feb 2018 16:46:10 +0000
- Accept-language: en-US
- Spamdiagnosticmetadata: NSPM
- Spamdiagnosticoutput: 1:99
|
Dear Jan-Christopher,
Thanks for your interest in MGET. I will try to help you with these problems.
The problem of the red circle with the X that will not go away has come up on our email list three times in the past 8 months or so. For these three users, the X would come up on the first parameter of all MGET tools; as a result, none of them could be executed. Uninstalling and reinstalling MGET did not fix the problem. One user was able to isolate the problem and said that “it was related to a corrupt/missing install of NumPy”. Numpy is a Python package for numerical processing. I have inquired with this user for more information about how he discovered that numpy was corrupt or missing and how he fixed the problem. I presume he either installed numpy manually, or uninstalled and reinstalled ArcGIS, which would redo everything.
Have you ever installed Python or any Python packages other than MGET or pywin32 yourself? That is often how problems come up that prevent any of MGET from working. In general, I recommend not installing Python manually unless you are an expert Python user. ArcGIS installs a copy of Python and several Python packages, including numpy. Unless you have a specific reason to install your own copy of Python, it is best to go with the copy ArcGIS installs. ArcGIS configures that copy of Python to be aware of ArcGIS’s own Python packages (arcpy, arcgisscripting), without which no Python-based geoprocessing tools such as MGET will work. If you install your own copy of Python, you have to redo that configuration if you want those tools to work.
Until the X problem is fixed, there is not much point in discussing how to parameterize the tools to accomplish what you want. Let’s fix the X problem first.
I do have some general comments on the workflow needed to accomplish your objective. You should know that ArcGIS only offers limited support for netCDF files. You cannot use them as parameters to large numbers of tools, in the same way that you can for, say, rasters in GeoTIFF format, or shapefiles. Historically, the best strategy has been to first convert data from netCDF to some other format (e.g. GeoTIFF) before processing it with ArcGIS.
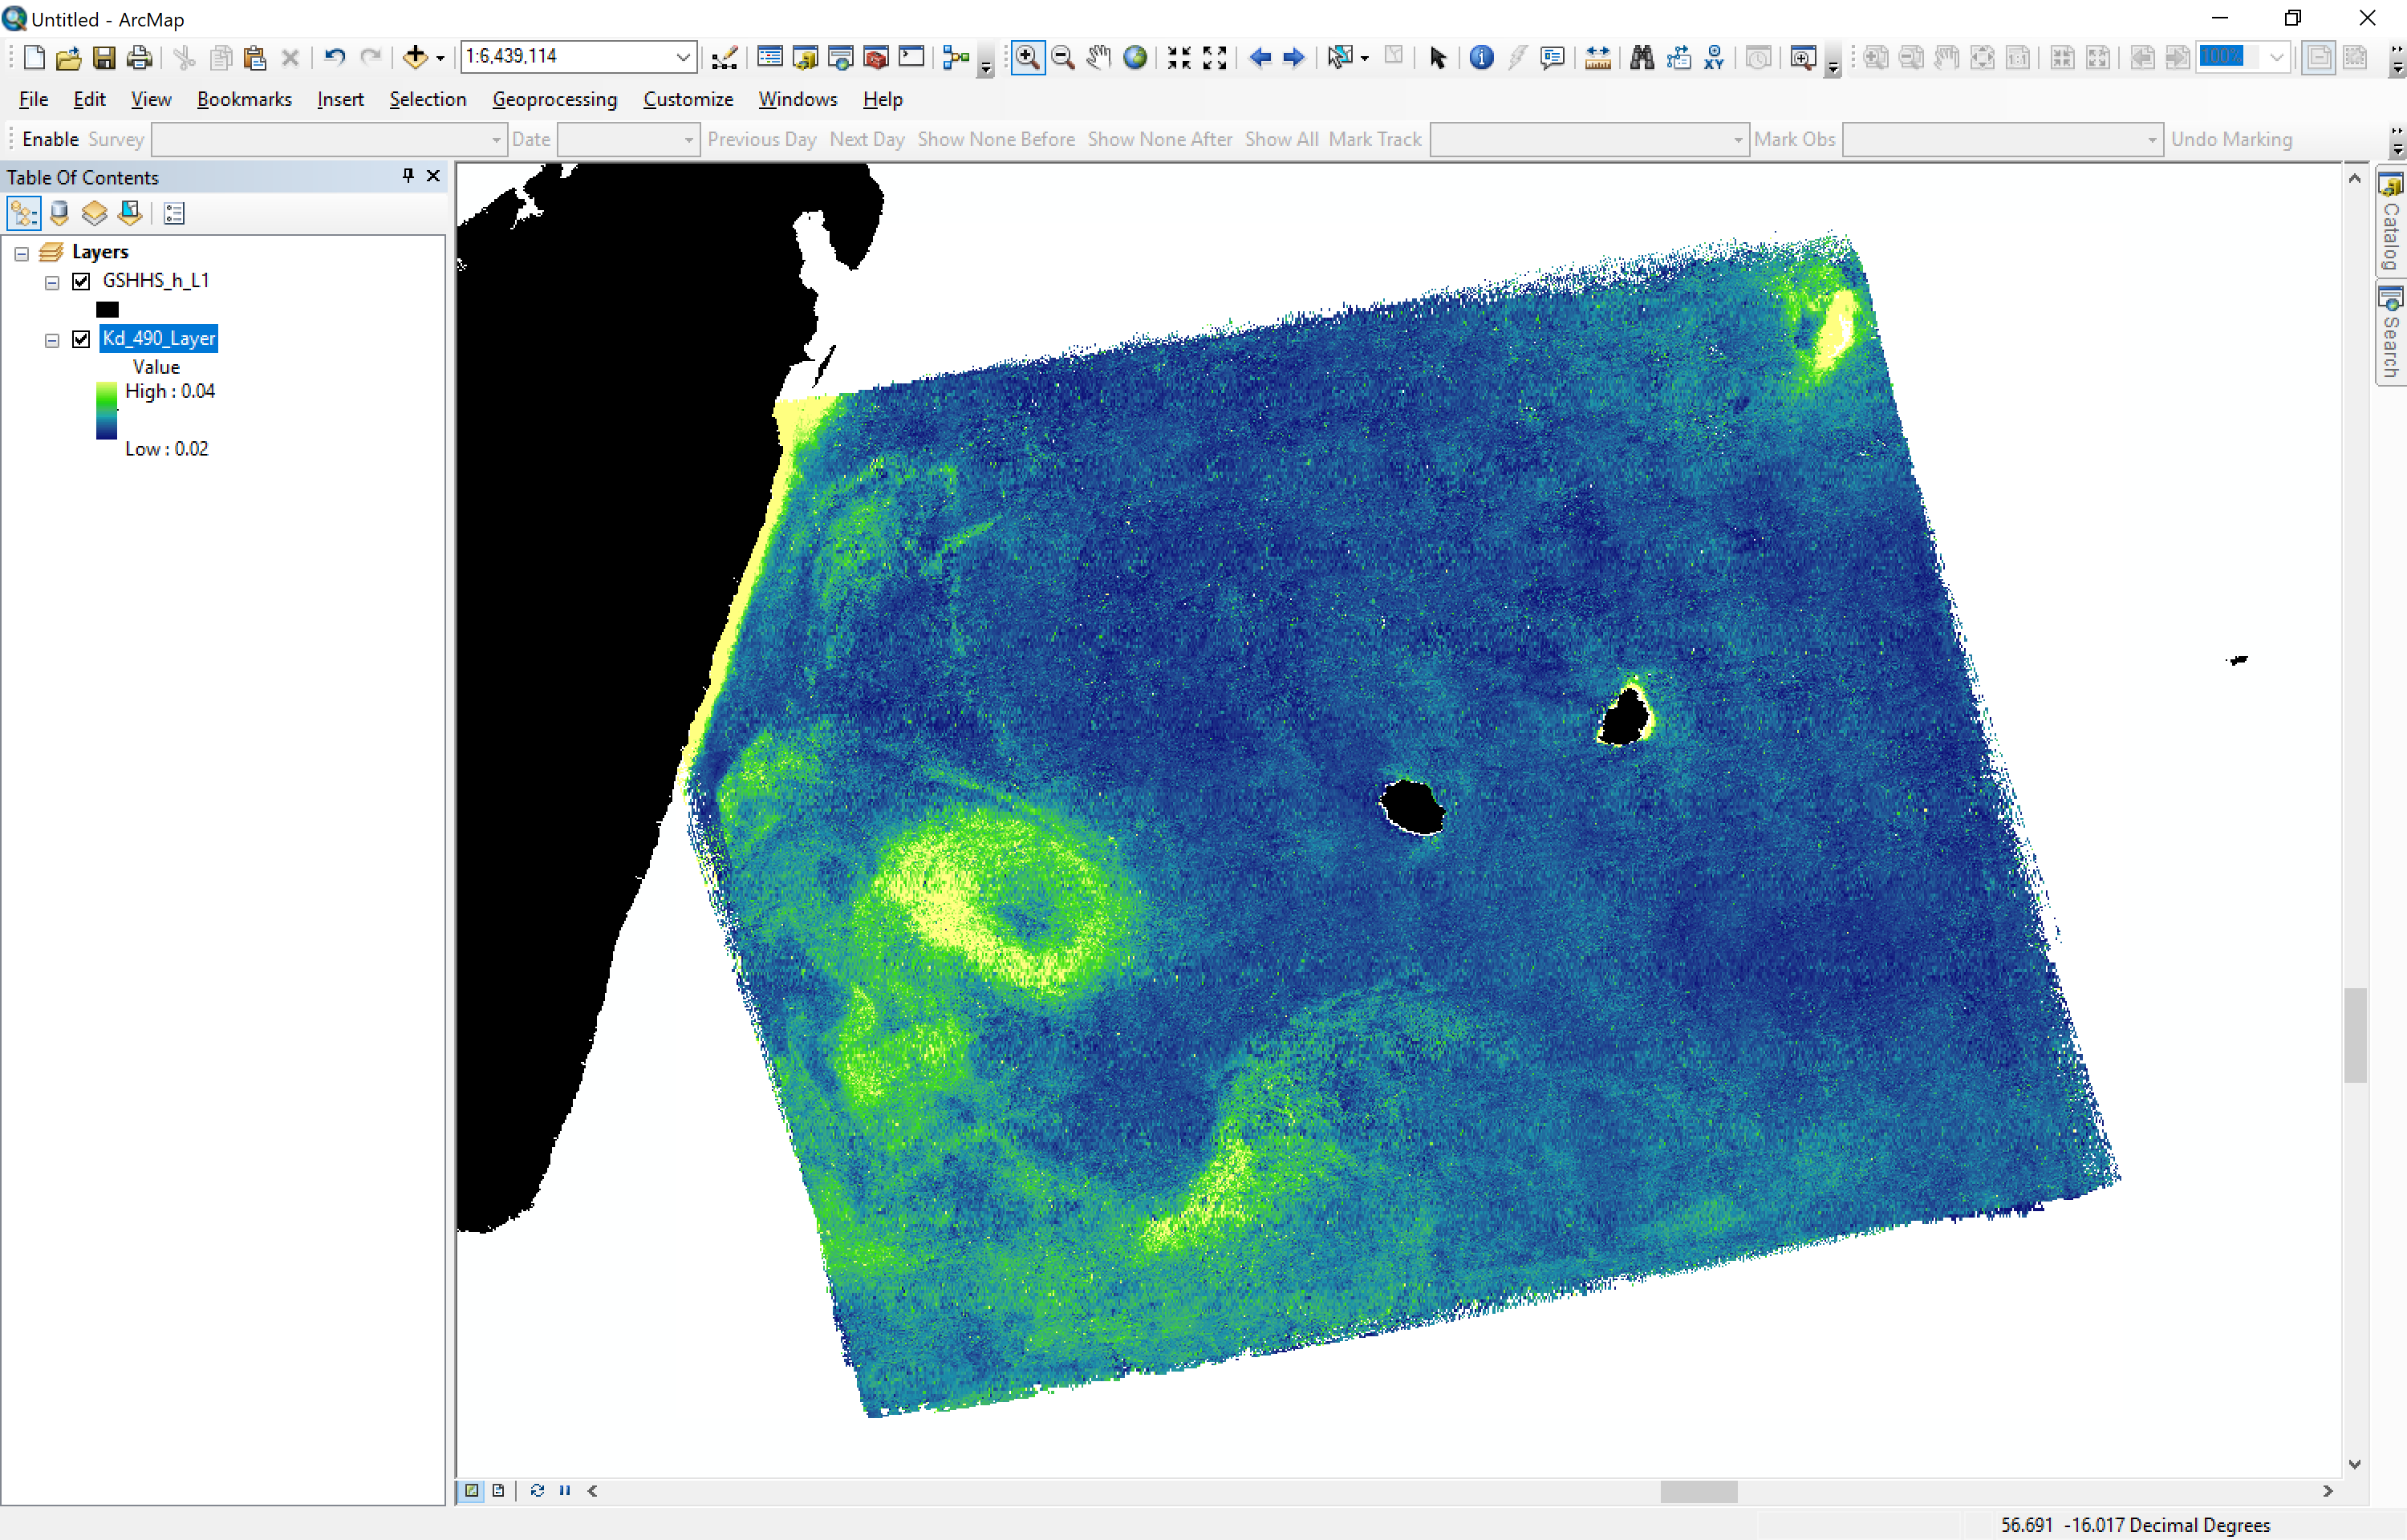
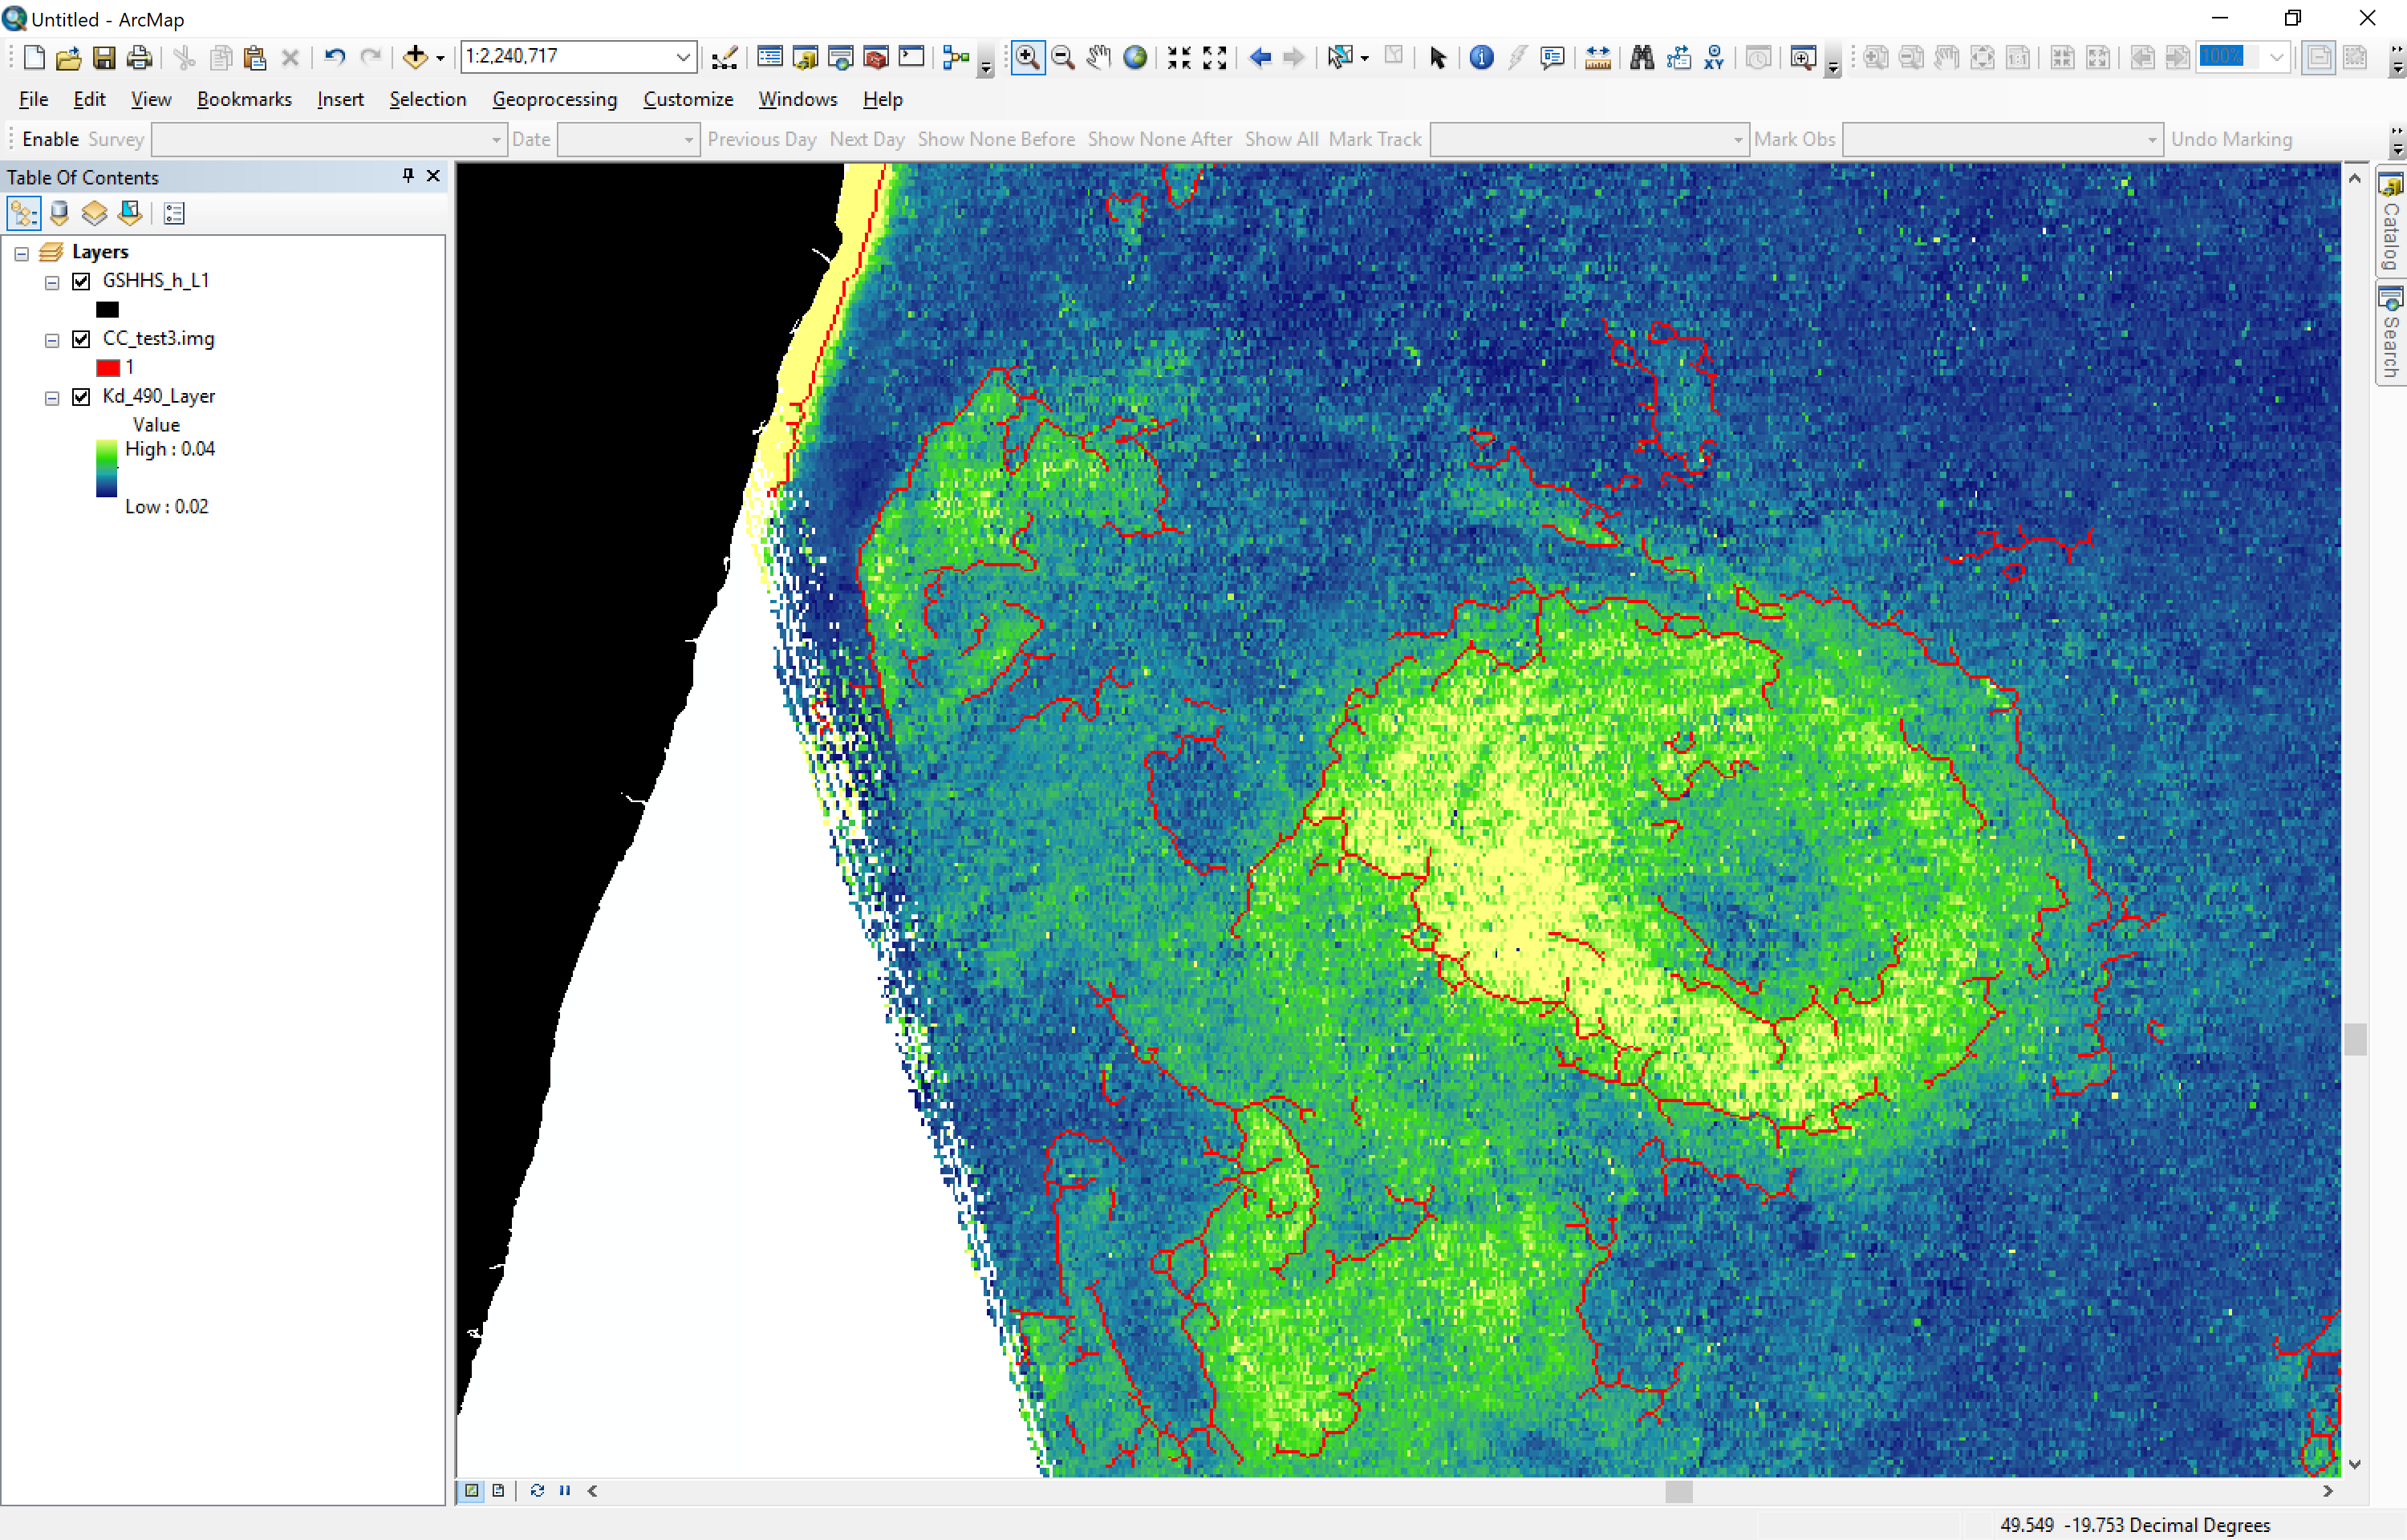
The situation has improved in recent years, in that ArcGIS now has some netCDF support under the Multidimension Tools toolbox, and that providers of netCDF data have better standardized their metadata and provided the necessary netCDF attributes more frequently. For netCDFs with proper metadata, the Make NetCDF Raster Layer tool (in Multidimension Tools) can create an in-memory raster layer from a netCDF variable, allowing it to be treated like a raster by many other tools. I was able to use that tool to make a map of the file you sent (attached Map.png) using ArcGIS 10.5. ArcMap did not choose a reasonable default symbology. I had to manually set it to a Miniumum-Maximum stretch and edit the high/low values to 0.02 to 0.04. I ran the MGET Cayula-Cornillon Fronts in ArcGIS Raster tool on that image and was able to find some fronts (attached Fronts.png).
This leads to a second caution for you. The Cayula-Cornillon tool has many parameters and they can be difficult to adjust. You may have to play around with it quite a lot to achieve a desirable result. The image you sent is very noisy (this is not surprising, in 1 km resolution images). The algorithm will perform better with some heavy filtering. The tool includes a median filter—I used a 5x5 one here—but you probably want to experiment with that, too.
Finally, it will be a huge amount of work and processing to run this on many years of images. You could spend most of your thesis working on this processing. You will need to write code to accomplish it.
So, I don’t want to “throw cold water” on your project idea, but I do want to caution you that it will likely be quite a lot of work to accomplish it. If you are self-motivated, adept at solving technical problems, and are comfortable writing code, it is achievable. I’m sorry to not have a more automated solution at this time, but we have not had direct funding for MGET in many years so there is little opportunity to automate it.
All the best,
Jason From: [mailto:]
On Behalf Of Jan-Christopher Fischer
Dear MGET Team,
my name is Jan-Christopher Fischer. I am studying Global Change Ecology at the University Bayreuth in Germany. In my master thesis I am currently working on the coastal turbidity around La Réunion, France. I am using level 2 MODIS Aqua daily 1km resolution Kd_490 data which I downloaded for the full duration from 2002 until 2017 from the Ocean Color Website (https://oceancolor.gsfc.nasa.gov/cgi/browse.pl?sen=am). I would like to use the “Cayula-Cornillon Fronts in ArcGIS Raster” function from your Marine Geospatial Ecology Tool Kit in ArcMap in order to detect and visualize turbidity fronts in the satellite data. Unfortunately, I have some problems with that and therefore would be very happy about your help: - First if I open the tool in ArcGIS, the warning/error symbol (red circle with white x) is there right away next to the “Input raster” field. This does not disappear at all. Is there a general wrong setting? - My downloaded and processed level 2 and level 3 files of Kd_490 are in nc (netCDF) format with floating points as pixel types (32 Bit). The scale factor of the Diffuse attenuation coefficient at 490 nm is 0.000199999994947575. So would the respective mapAlgebraExpression “int(inputRaster * 0.000199999994947575)” be? By typing this in and clicking on “Usage…” the “Grid Map Algebra Usages” interface opens. What do I have to select here? And how to apply whatever I might select? The only given option is “cancel”. - Is there a way to use the nc files as input raster? I attached an example file to this mail… - I thought a conversion of the nc files to tif format might solve this problem. In this case the pixel type is signed integer with a pixel depth of 16 bit. The values for this file displayed in ArcMap reach from high: 3514 to low: -32767. Which front detection threshold shall is set for this file? I have (and can not remove) the warning/error symbol here again next to the “Input raster” field. What is the reason for this?
I am sending lots of diffuse questions but I don´t know how to solve this. Can you help me to detect the fronts in the files downloaded from the Ocean Color Website? Your help is highly appreciated. Thanks in advance! Looking forward to hear from you.
Kindest regards, Jan-Christopher
___
Mit freundlichen Grüßen / Kindest regards, Jan-Christopher Fischer Student of Global Change Ecology (M.Sc.)
|
Attachment:
Map.png
Description: Map.png
Attachment:
Fronts.png
Description: Fronts.png
- [mget-help] Cayula-Cornillon Fronts in ArcGIS Raster, Jan-Christopher Fischer, 02/05/2018
- RE: [mget-help] Cayula-Cornillon Fronts in ArcGIS Raster, Jason Roberts, 02/06/2018
Archive powered by MHonArc 2.6.19.