Subject: Marine Geospatial Ecology Tools (MGET) help
Text archives
- From: Jason Roberts <>
- To: Diana Margarita Carrillo García <>
- Cc: "" <>
- Subject: RE: [mget-help] MGET Connectivity Modeling Tool
- Date: Fri, 30 Nov 2018 16:15:35 +0000
- Accept-language: en-US
- Spamdiagnosticmetadata: NSPM
- Spamdiagnosticoutput: 1:99
|
Dear Diana,
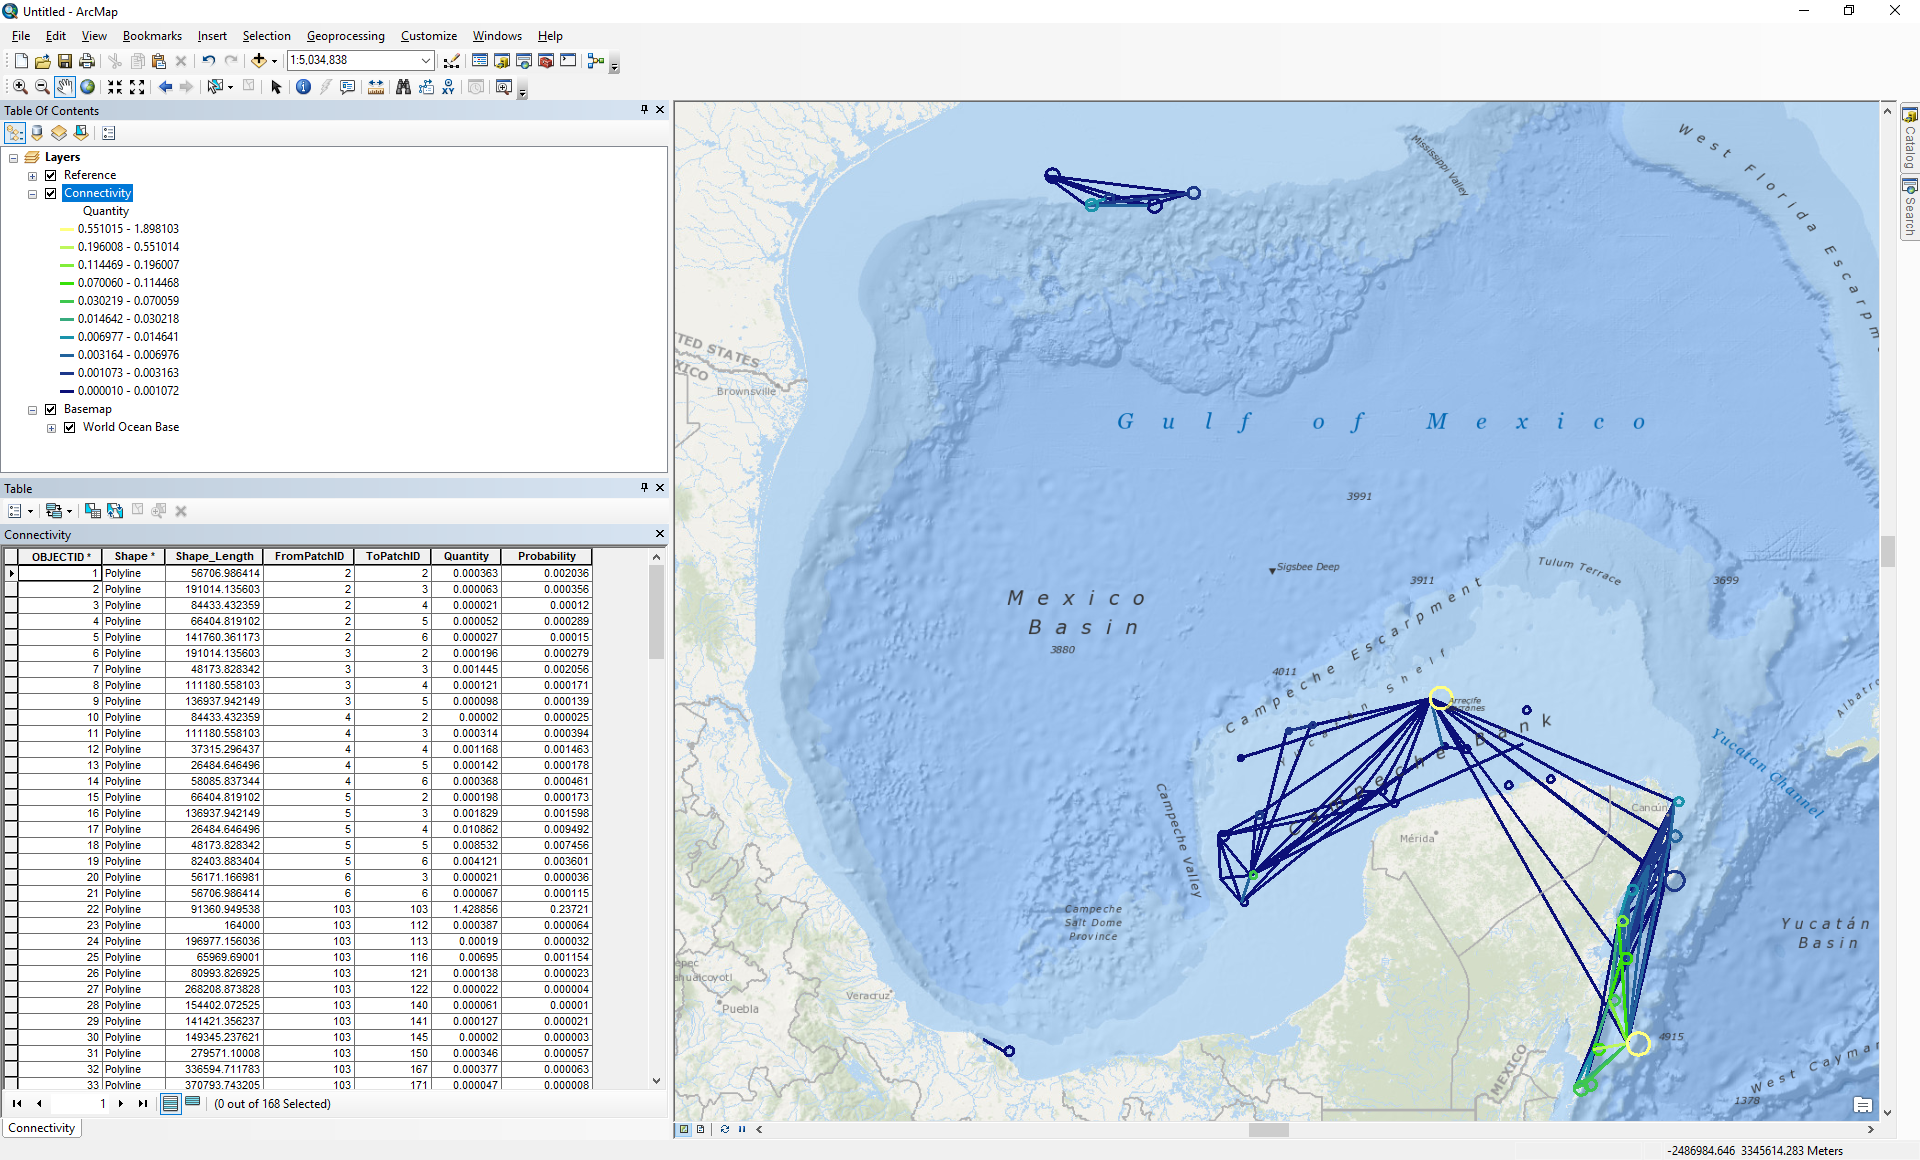
Your project sounds interesting. I’m sorry we have not updated the blog entry to discuss that step. You can view the documentation of that tool here. It creates three outputs:
1. A survivorship curve. 2. A time series of rasters showing the density of larvae as the simulation progresses. You can animate these with ArcMap. 3. A shapefile giving the connectivity matrix. You can use that to produce maps like the one attached, or to perform further analysis.
Best regards,
Jason
From: <>
On Behalf Of Diana Margarita Carrillo García
Dear Professor,
My name is Diana Carrillo I am working on a master´s degree project wich aims to model de connectivity of fish and coral species in the Gulf of Mexico, I am interested on using the Marine Geospatial Ecology Tools for that purpose. I had reviwed the website http://mgel2011-kvm.env.duke.edu/mget/2016/03/31/new-larval-connectivity-modeling-tools/ but I would like to know if there is more information, especially about the section "Visualize the results"
With regards, Diana Carrillo |
Attachment:
GoMex_connections_example.png
Description: GoMex_connections_example.png
- [mget-help] MGET Connectivity Modeling Tool, Diana Margarita Carrillo García, 11/28/2018
- RE: [mget-help] MGET Connectivity Modeling Tool, Jason Roberts, 11/30/2018
Archive powered by MHonArc 2.6.19.