Subject: Marine Geospatial Ecology Tools (MGET) help
Text archives
- From: Liz Atwood <>
- To:
- Subject: [mget-help] Cayula-Cornillon histogram stride width artifacts
- Date: Wed, 9 Mar 2016 10:33:16 +0100
|
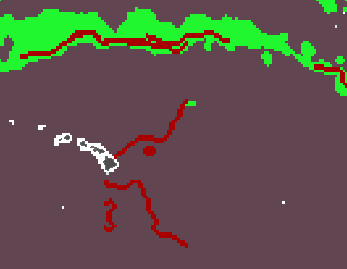
Dear mget developers, First and foremost, thank you for developing such a comprehensive tool for the field. I am working on calculating Cayula-Cornillon fronts for the N Pacific from various remotely sensed datasets, and I have begun the endeavour using a SMOS surface salinity product. I've got the tool up and running with a python script run from ArcMap 10.3 (avoiding the GUI since I'll eventually have quite a few images to process). Using the default value histogramWindowStride=16 and then combining products from 18 different dates (simply summing them at the moment), one sees that the algorithms is producing artifacts along what I assume to be the histogram window edge, notice the horizontal boundaries below (I've indicated one in red - they come every 16 pixels, darker blue color indicates pixels where more often a front was detected). 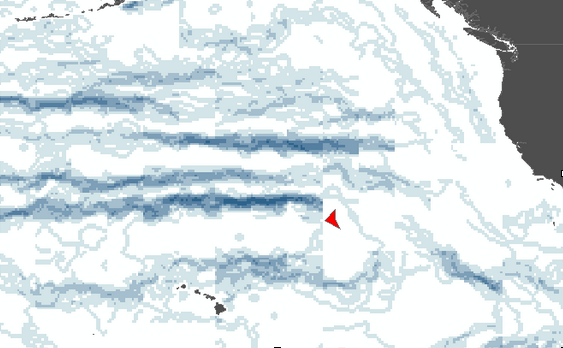 Ok, but I've got a powerful enough computer and so started experimenting with smaller histogram stride windows. Using a stride of 1 does not take very long on my system (about 15 seconds) and removed all horizontal boundary artifacts. BUT some of the fronts now disappear, including before activating the thinning step. The left image is the unthinned, stride=1 Cayula-Cornillon product for a single salitiny image (green=1, gray=0). The right image has the stride=16 product overlaid (in red), where one can see that, while the northern front is now correctly not being cut-off, the lower fronts near Hawaii are being detected very differently. 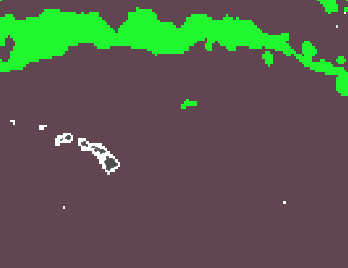 Any ideas why this would be the case, is there much experience using a stride=1 or are there other ways to avoid the horizontal boundary artifacts shown above? I've included my python script below, if helpful despite its being pretty basic. Thanks for any help you might be able to provide. Best, Liz --
Elizabeth C. Atwood
M.Sc. Quantitative Ecology & Resource Management
# this script uses the Cayula-Cornillon algorithm to detect fronts
# for a layer of sea surface salinity images
import arcpy, os, sys
from arcpy import env
from arcpy.sa import *
import GeoEco
from GeoEco import *
import GeoEco.OceanographicAnalysis.Fronts
from GeoEco.OceanographicAnalysis.Fronts import *
mxd = arcpy.mapping.MapDocument("CURRENT")
for lyr in arcpy.mapping.ListLayers(mxd, "BEC_L4_*"):
temp = lyr
tempFile = str(temp)
tName = "D:/Liz/Expedition_Daten/SEA_Law_Pacific/2012/MODIS_A/sss/CayulaCornillonFronts/testing/"+tempFile[0:38]+"_CCfronts.tif"
layer = "D:/Liz/Expedition_Daten/SEA_Law_Pacific/2012/MODIS_A/sss/CayulaCornillonFronts/testing/"+tempFile
# CayulaCornillonEdgeDetection.DetectEdgesInArcGISRaster(layer, 10, tName)
tName2 = "D:/Liz/Expedition_Daten/SEA_Law_Pacific/2012/MODIS_A/sss/CayulaCornillonFronts/testing/"+tempFile[0:38]+"_CCfronts_thin.tif"
CayulaCornillonEdgeDetection.DetectEdgesInArcGISRaster(layer, 30, tName, histogramWindowStride=1)
CayulaCornillonEdgeDetection.DetectEdgesInArcGISRaster(layer, 30, tName2, histogramWindowStride=1, thin=True)
|
- [mget-help] Cayula-Cornillon histogram stride width artifacts, Liz Atwood, 03/09/2016
- RE: [mget-help] Cayula-Cornillon histogram stride width artifacts, Jason Roberts, 03/09/2016
- Re: [mget-help] Cayula-Cornillon histogram stride width artifacts, Liz Atwood, 03/09/2016
- Re: [mget-help] Cayula-Cornillon histogram stride width artifacts, Liz Atwood, 03/10/2016
- Re: [mget-help] Cayula-Cornillon histogram stride width artifacts, Liz Atwood, 03/09/2016
- RE: [mget-help] Cayula-Cornillon histogram stride width artifacts, Jason Roberts, 03/09/2016
Archive powered by MHonArc 2.6.19.